Minor Functions
The minor functions within the wastewateR package can be called and used individually, to maximize the flexibility of the entire package. However, these functions are mainly used within the wrapper-type of the Main Functions.
Function Listings:
For Processing
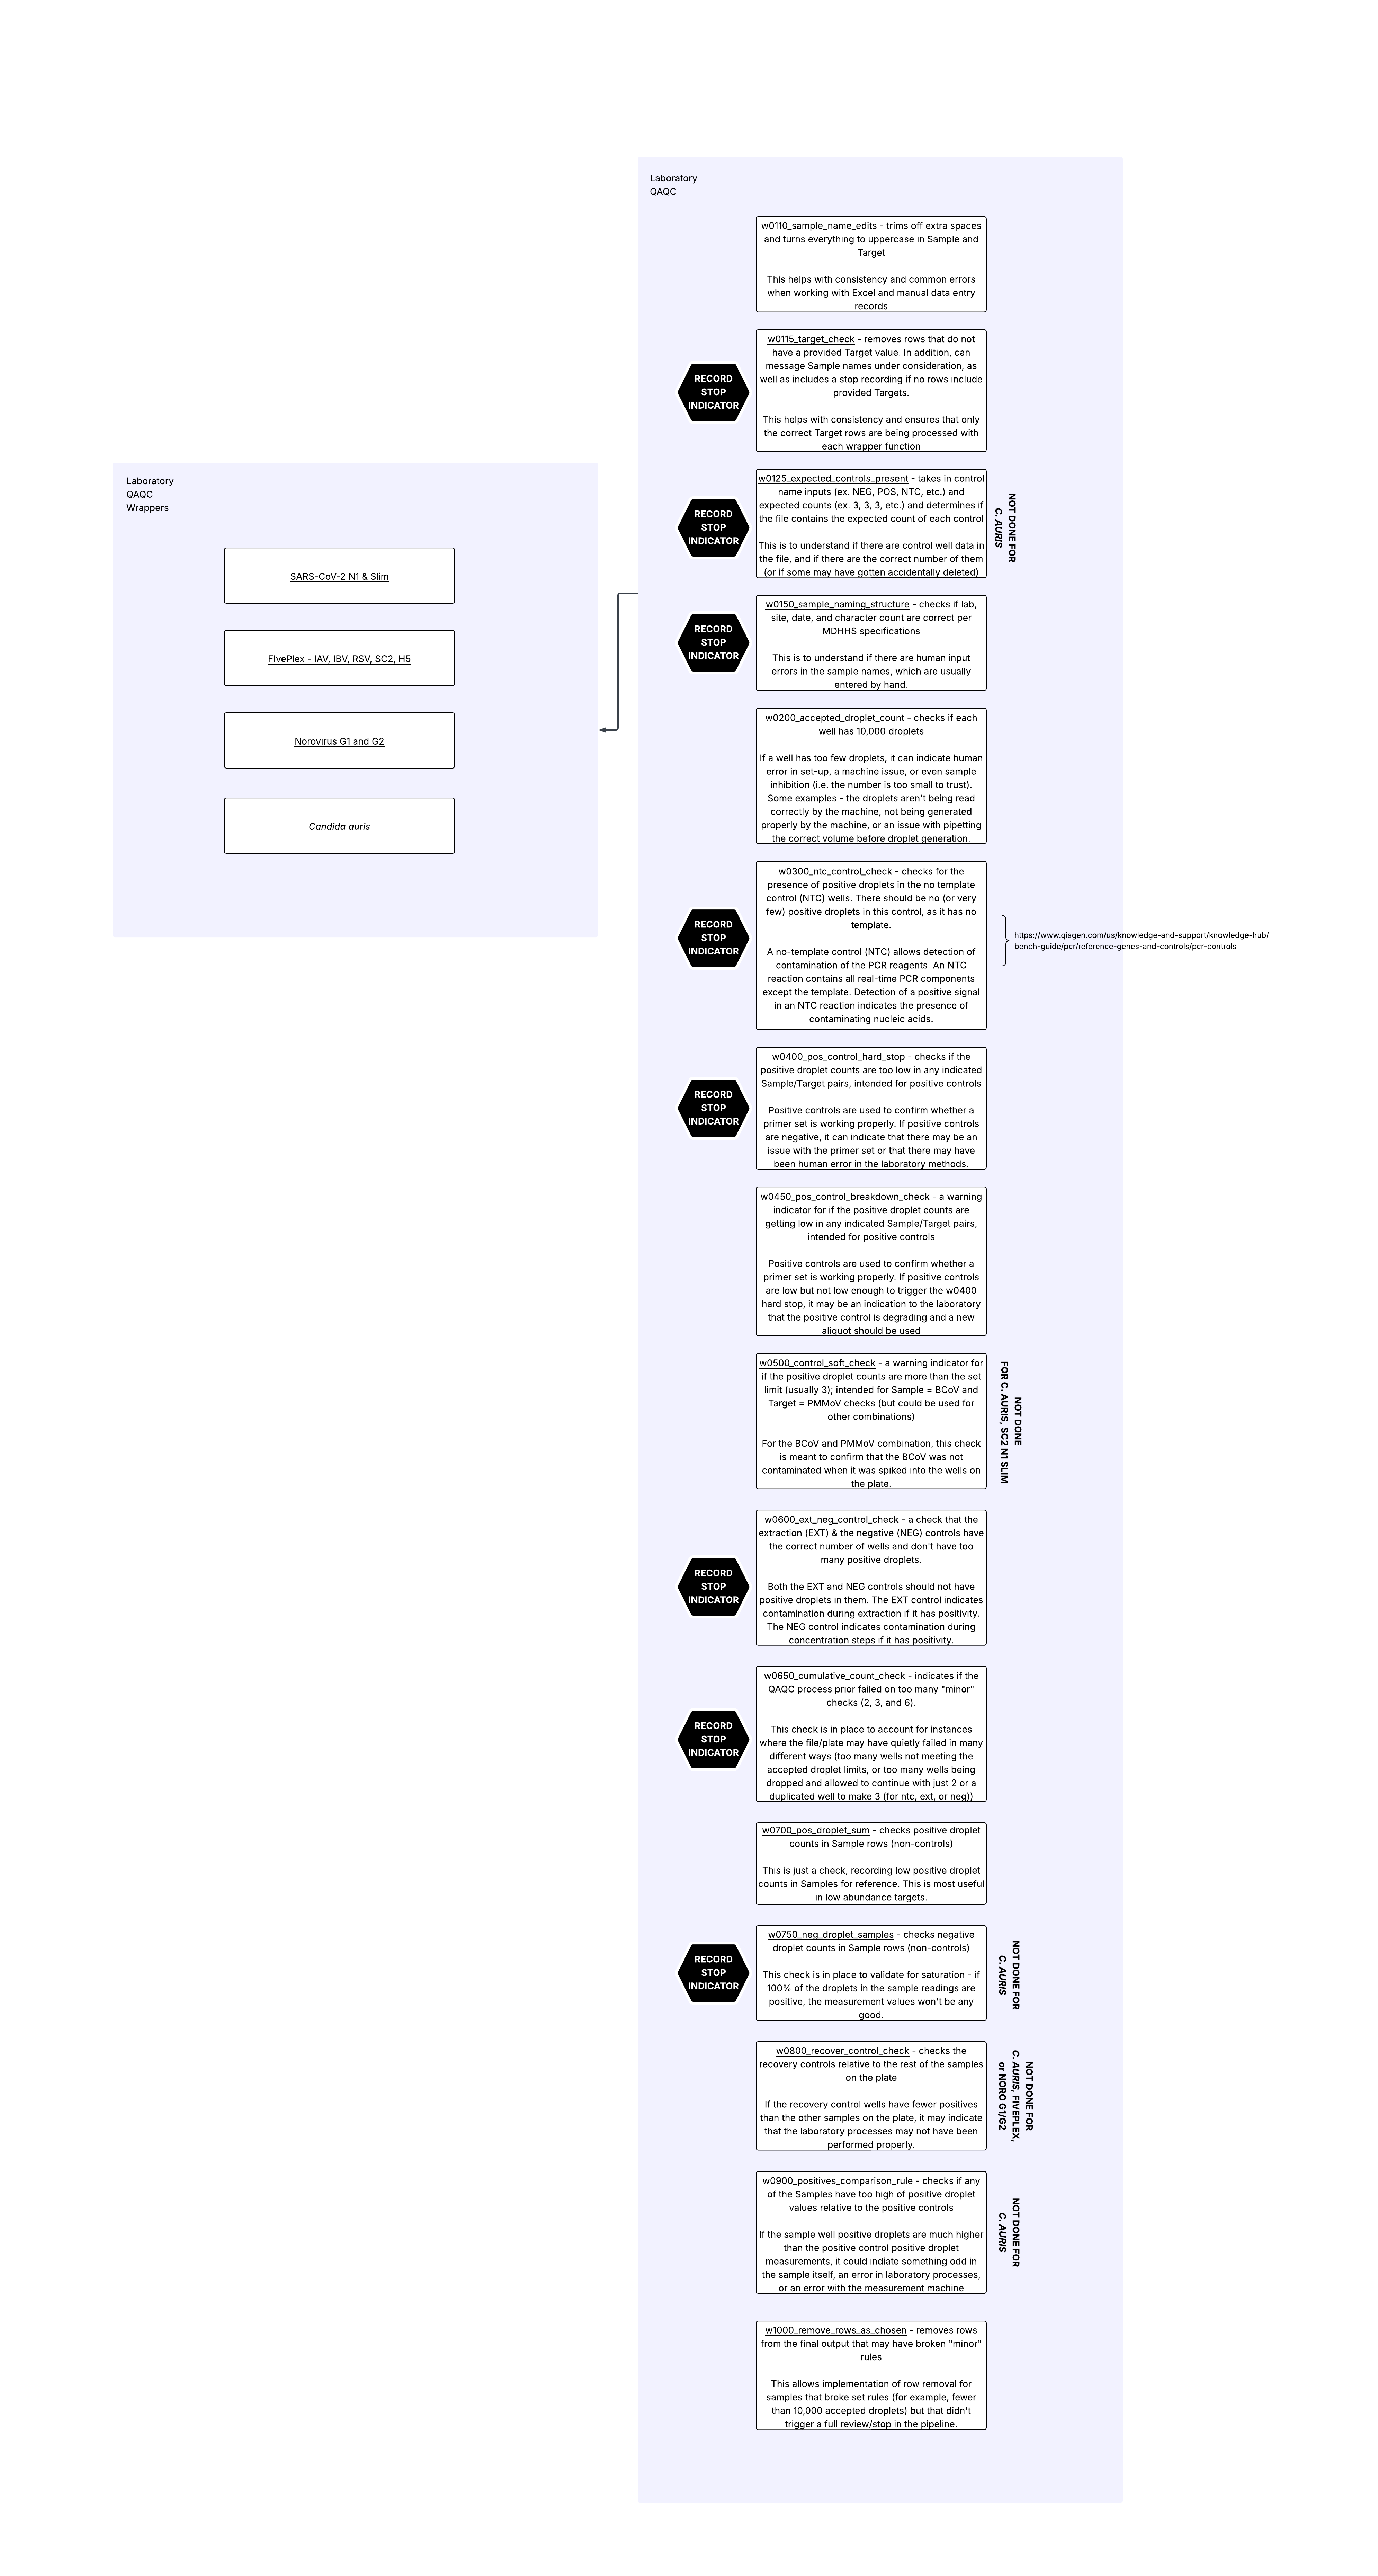
w0110_sample_name_edits()
Basic Description: Edit Sample and Target names to remove spaces and change letter-type characters to uppercase.
This function takes in a data frame and cleans up sample and target names for consistency. The function does assume the sample names are in a column called Sample, and that the target names are in a column called Target. It does not create any new columns, it only edits the contents of existing columns. A single dataframe is returned.
Removes all spaces from strings in
SampleandTarget(leading, lagging, and interior)Changes all letter characters in
SampleandTargetto capitalized / uppercase letters.
Function:
w0110_sample_name_edits(df_in)
w0115_target_check()
Basic Description: Target Confirmation and optional Sample write-out; Optional stop.
The purpose of this function is to check that the Targets included in the data file provided are the Targets the user is expecting, to remove any Targets that are not expected, and to have an optional message stating the Sample & Targets included in the run.
This function takes in:
new_file_in: a dataframe of laboratory results; a column called “Sample” and a column called “Target” are required components
targets_allowed: a vector of character strings indicating the Target values the user would like to allow
message_samples: a character string “yes” or “no” indicating whether the user would like a message write-out of all samples continuing to be used
stop_choice: A character string of “yes” or “no” to indicate whether this should be a hard stop function or not
This function will print to the console the list of targets the user provided as being allowed, followed by the list of targets that are in the provided dataframe of laboratory results (new_file_in).
It will then filter the dataframe of laboratory results so that it only contains rows where the Target values are in the list of targets the user provided as being allowed. It will print out the number of rows that were removed. If all rows were removed, that is a stop indicator option.
If message_samples is “yes”, then the samples that are still in the data frame will be printed to the console, by Target (if multiple targets remain in the data file).
If the stop_choice is “yes” and all rows were removed due to the Target filtering, then the code will hard stop. If the stop_choice is no, the code will continue, and a list of the filtered dataframe and the stop indicator of 0 (no stop rule reached) or 1 (stop rule reached) will be returned by the function.
Function:
w0115_target_check(new_file_in, targets_allowed, message_samples = "yes", stop_choice = "no")
w0125_expected_controls_present()
Basic Description: Check for the presence of expected control labeling in Sample column; Optional stop.
This function takes in a data frame of laboratory data and checks for the presence of control wells. This function also takes in a vector of character strings to use to identify control wells, and a numeric vector of the expected number of wells for each control type. The two vectors should be the same length. All it does is provide some alerts regarding control sample well presence/absence it does not edit the input - input and output are identical in this case.
The default controls the system is looking for are Sample names that contain: “NEG”, “POS”, “NTC”, “EXT”, “BCOV”
The default numeric vector of the expected number of wells is: 3, 3, 3, 3, 3
Please note: This check will not alert if there is a control that is NOT mentioned.
If stop_choice is “no” then: The error information will print to the console and the return list will have the output data frame as the first element in the list and a stop indicator of 1 as the second element in the list.
if stop_choice is “yes” then: STOP ALERT: If there are any instances of inconsistencies between the actual number of control wells identified and the expected number as indicated by the two input vectors, the offending control type and the well counts will be printed to the console. The code will STOP RUNNING if this occurs.
If stop_choice is “no” and the criteria for stopping is still met, the code will not stop but the second element of the return list will record the stop event as a “1”.
This function returns a list with the first element being a dataframe identical to df_in, and the second element being either 0 (for no failure stop) or 1 (for failure stop)
Function:
w0125_expected_controls_present(df_in, exp_cntrl_v = c("NEG", "POS", "NTC", "BCOV", "EXT"), expected_count = c(3, 3, 3, 3, 3), stop_choice = "no")
w0150_sample_naming_structure()
Basic Description: Check that the sample naming structure is as expected, including the site identifier, date format and range, and character count, specifically for the Michigan Department of Health and Human Services SEWER program; Optional stop.
This function was specifically crafted to accommodate the sample naming convention of the SEWER program in Michigan. If you’d like a sample naming function created for your laboratory/program, please reach out to the owner of this repository.
This function takes in a data frame. It also takes in a vector of character strings for acceptable site identifiers, and a vector of control strings. It does not edit the input dataframe – input and output dataframes are identical in this case.
The vector of character strings for submitter ids and the vector of acceptable site abbreviations should align with the following sample naming structure: - there should be 11 characters in the sample name - submitter identifier, two characters & city/site identifier, two character as one input - date of sample collection in YYMMDD format - Sample end indicator: I or S, for influent or solid, or A, for first sample collected in a given day
We’re working exclusively with the ‘Sample’ column.
In the ‘Sample’ column, all leading and lagging spaces are removed from each sample name. A new column for the number of characters in each sample name is made, and a new column identifying each row as either “NOT A CONTROL” or “Control” is made.
Controls: - Sample name contains any of the character strings indicated
Everything else is labelled “NOT A CONTROL”. The system then only considers sample names that are labelled “NOT A CONTROL” for the checks outlined here.
The system will account for “_2”, “_3”, or “_4” at the end of a sample name to identify if the same sample is tested multiple times on the same plate, or on different plates. These will run through and will not trigger an “over 11 characters” stop.
If stop_choice is “yes”: STOP ALERT: All NOT A CONTROL samples that are NOT 11 characters in length are pulled and if there are one or more instances of this, the offending sample names will be printed to the console with “Sample Names are Not 11 Characters”. The code will STOP RUNNING if this occurs.
If stop_choice is “no” and the criteria for stopping is still met, the code will not stop but the second element of the return list will record the stop event as a “1”.
Each sample name is then broken down into five new columns, corresponding to the first two characters, the next two characters, the six characters after that, those six characters transformed into an R date data type, and the last character.
Individual checks are then run on each of these columns:
- That the first four characters of non-control rows are an option provided in the vector of acceptable site identifiers
- That the next six characters of all non-control rows are numbers, and a date not in the future
- That the last character of non-control wells is either an I, S, or an A
If stop_choice is “yes”: STOP ALERT: If any of those three checks do not pass, the offending sample names will be printed out to the console along with a relevant check message. The code will STOP RUNNING if this occurs.
If stop_choice is “no” and the criteria for stopping is still met, the code will not stop but the second element of the return list will record the stop event as a “1”.
In addition, the system checks that the sample dates of non-control sample rows are not older than 6 months ago. This check only notifies if any of them are, it is not a stop check.
This is an example of a function that could be replaced with another function that applied the sample naming rules that different individuals/organizations use.
This function returns a list with the first element being a dataframe that is identical to the input dataframe, and the second element being either 0 (for no failure stop) or 1 (for failure stop).
Function:
w0150_sample_naming_structure(df_in, site_identifiers, control_strs, stop_choice = "no")
w0200_accepted_droplet_count()
Basic Description: Check Accepted Droplet Count
This function takes in a data frame of laboratory data and a numeric droplet count limit that by default is set at 10,000. It checks if every well has an accepted droplet count greater than or equal to the droplet count limit.
Two new columns are added to the data frame:
accepted_droplet_limit2: assigned a value of 1 if the row has less than the droplet count limit in theAcceptedDropletscolumnaccepted_droplet_count2: for eachSampleandTargetcombination, contains the value of the number of wells that were below the limit.
If all the repetitions were above the limit, the value will be 0, if one well in the set of repetitions was below the limit, the value will be 1 for all rows of the set, etc.
If all rows in the data frame are above the limit, there will be a message printed to the console. If there are any that were below the limit, the Sample, Target, and the AcceptedDroplet values will be printed to the console as well.
Function:
w0200_accepted_droplet_count(df_in, droplet_count_limit = 10000)
w0300_ntc_control_check()
Basic Description: No Template Control (NTC) check for Positive Droplets; Optional stop.
This function takes in a data frame of laboratory data, as well as a numeric positives droplet limit. It also takes in a character string “yes” or “no” to indicate if the function should act as a hard stop or not.
This function only needs to be run if there are NTC control well data in the data file.
It looks only at rows where the character string “NTC” is present in the Sample column. If the Positives column for any of those rows is greater than or equal to the positives droplet limit, it will mark those rows. The default positives droplet limit is 3.
A new column ntc_control_check3 will be added to the data frame, which will contain a value of 1 if the sample name contains “NTC” AND the Positives value is greater than or equal to the positives droplet limit set by the user. Otherwise, the value will be 0.
If stop_choice is “yes”: STOP ALERT: If the NTC rows have more than one well / row that is over the droplet limit, all NTC rows will be printed to the console - Sample, Target, Positives, and AcceptedDroplets columns. The code will STOP RUNNING if this occurs.
If stop_choice is “no” and the criteria for stopping is still met, the code will not stop but the second element of the return list will record the stop event as a “1”.
This function returns a list with the first element being a dataframe identical to df_in with one additional column, and the second element being either 0 (for no failure stop) or 1 (for failure stop).
Function:
w0300_ntc_control_check(df_in, positive_droplet_limit = 3, stop_choice = "no")
w0400_pos_control_hard_stop()
Basic Description: Checking if Positive Droplet counts are too low; Optional stop.
This function takes in a data frame of laboratory data, as well as a dataframe of Sample-Target pairs to apply this check to. It also takes in a numeric positives droplet limit. The default positives droplet limit is 3. It also takes in “yes” or “no” as a character string for whether to treat this function as a hard stop or not.
It is a Positive Control Well Check for any ‘Sample’ and ‘Target’ pair that contains the strings indicated in the rows of the indicating data frame.
Sample-Target pairs example:
If the dataframe looks like:
| Sample | Target |
|---|---|
| POS | N1 |
| BCOV | BCOV |
Then the code will look for any instances where the ‘Sample’ column contains the string “POS” AND the ‘Target’ column contains the string “N1”, and any instances where the ‘Sample’ column contains the string “BCOV” AND the ‘Target’ column contains “BCOV”. Those rows are exclusively looked at for applying the positive droplet limit to the values in the ‘Positives’ column.
if stop_choice == “yes”: STOP ALERT: If any row has fewer positive droplets than the positives droplet limit, the offending Sample, Target, and Positives column values will be printed to the console. The code will STOP RUNNING if this occurs.
A zero or a one is returned from this function - A 1 if the stop check was triggered and the stop_choice was “no”, and a zero if the stop check was not triggered.
Function:
w0400_pos_control_hard_stop(new_file_in, samples_targets, pos_drop_lim = 3, stop_choice = "no")
w0450_pos_control_breakdown_check()
Basic Description: Check for Potential Breakdown in (Positive) Controls with Positive Droplets Limit (checking if Positive Droplet counts are lower than indicated)
This is just a check/warning function.
This function takes in a dataframe of laboratory data, as well as a dataframe of Sample-Target pairs to apply this check to. It also takes in a numeric positives droplet limit. The default positives droplet limit is 20. It is a Positive Control Well Check for any Sample and Target pair that contains the strings indicated in the rows of the indicating data frame.
Sample-Target pairs example:
If the dataframe looks like:
| Sample | Target |
|---|---|
| POS | N1 |
| BCOV | BCOV |
Then the code will look for any instances where the Sample column contains the string “POS” AND the Target column contains the string “N1”, and any instances where the Sample column contains the string “BCOV” AND the Target column contains “BCOV”. Those rows are exclusively looked at for applying the positive droplet limit to the values in the Positives column.
If there are any wells that are below the set threshold, a warning note will be printed to the console, and the Sample, Target, Concentration, CopiesPer20uLWell, and Positives column values for all indicated positive control wells will be printed to the console as well. The rows that triggered the alert will be marked with a “***“.
If there are not any wells that are below the set threshold, the Sample, Target, Concentration, CopiesPer20uLWell, and Positives column values for all indicated positive control wells will be printed to the console just for informational purposes.
A new column will be added to the dataframe, called pos_control_breakdown, recording any possible positive control breakdowns as ones, and otherwise being filled with zeros. Any rows that were not considered in this check will have NA filled in this column.
Function:
w0450_pos_control_breakdown_check(new_file_in, samples_targets, limit_number = 20)
w0500_control_soft_check()
Basic Description: Control Warning, checking if Positive Droplet counts are greater than indicated
This function takes in a laboratory data frame, as well as a dataframe of Sample-Target pairs to apply this check to. It also takes in a numeric positives droplet limit. The default positives droplet limit is 3.
Sample-Target pairs example:
If the dataframe looks like:
| Sample | Target |
|---|---|
| BCOV | PMMOV |
This check looks at the indicated control rows and marks them if the number of positive droplets is greater than or equal to the numeric droplet limit. The mark occurs in a column called control_pos_drop_soft5, which will contain a value of 1 if the Positives column of the indicated Sample-Target pairs is greater than or equal to the droplet limit, and otherwise will contain zeros. Any rows that were not considered in this check will have NA filled in this column.
This function returns a dataframe with a new column.
Function:
w0500_control_soft_check(new_file_in, samples_targets, pos_drop_limit = 3)
w0600_ext_neg_control_check()
Basic Description: Extraction Control Check; Optional stop.
This function was intended for extraction control (EXT) and negative control (NEG) ‘Sample’ rows, but it can check others. It is looking for the extraction control as a target.
It takes in:
a laboratory data frame
a vector of the two control types to check
a numeric indicator for how many of the first value control wells are expected
a numeric indicator for how many of the second value control wells are expected
whether to check for positivity or negativity (higher or lower than the limit)
a numeric positive droplet limit; default value is 3
an acceptable number of wells that you’d allow to be over the positive droplet limit (for example, if you had run a control in quaduplicate, you might still accept the plate data results if 2 of the 4 controls were over the positive droplet limit, so you’d enter 2); default value is 1
a character string of “yes” or “no” for whether the user would like to treat this function as a hard stop function
Rows that are considered have the indicated control strings in the “Sample” column, and have the extraction control indicated (such as BCOV or PHI6) as the Target.
if stop_choice == “yes”:
STOP ALERT: If either of the two indicated controls have more than the indicated acceptable number of wells with a ‘Positives’ (positive droplet measurement) greater than or equal to the indicated positive droplet limit, the ‘Sample’, ‘Target’, and ‘Positives’ column values will be printed to the console. The code will STOP RUNNING if this occurs.
If either of the two indicated controls have more than zero wells with a ‘Positives’ (positive droplet measurement) greater than or equal to the indicated positive droplet limit, the ‘Sample’, ‘Target’, and ‘Positives’ column values will be printed to the console.
A new column called ext_neg_control_check6 is added to the dataframe, where indicated control rows with a ‘Positives’ (positive droplet measurement) greater than or equal to the indicated positive droplet limit are marked with 1, otherwise they are marked with 0. Non-relevant rows are marked with ‘NA’.
A list of a data frame and a numeric indicator of 0 (if no stop trigger was encountered) or 1 (if a stop trigger was encountered) is returned from this function.
Function:
w0600_ext_neg_control_check(new_file_in, two_control_options = c("EXT", "NEG"), extraction_control_value = "BCOV", pos_or_neg = "negative", positive_droplet = 3, wells_over = 1, stop_choice = "no")
w0650_cumulative_count_check()
Basic Description: Cumulative Error Check for noted previous checks; Optional stop.
This function is just a “check” function. This function takes in a dataframe that has at least been through checks 2, 3, and 6 prior. It also takes in a numerical value corresponding to the number of acceptable failed well checks that the user is willing to accept across checks 2, 3, and 6. The default set value for this is 3. In addition, the function accepts either a “yes” or “no” character string, indicating whether the limit should be a hard stop limit, or just a warning.
This function is checking the sum of:
accepted_droplet_limit2 / 3
ntc_control_check3
ext_neg_control_check6
If stop_choice is “yes”: STOP ALERT: If “yes” is entered as the last input into this function, and the sum of wells that failed checks 2, 3, and 6 is greater than the set numeric limit, the code will STOP RUNNING.
If stop_choice is “no” and the criteria for stopping is still met, the code will not stop but will return a “1”.
Regardless, this function will print a message to the console with the number of wells that failed each of checks 2, 3, and 6. It will then note whether the sum of these was greater than the set numeric limit, or not.
A zero or a one is returned from this function - A 1 if the stop check was triggered and the stop_choice was “no”, and a zero if the stop check was not triggered
Function:
w0650_cumulative_count_check(df_file_in, set_limit = 3, stop_choice = "no")
w0700_pos_droplet_sum()
Basic Description: Checking positive droplet counts in actual Sample rows (NOT controls)
This function is meant to be used to check non-control wells for low positive droplet counts. It is just a check function, it will not stop code from running.
This function takes in a dataframe of laboratory data, a numeric indicator for the sum of positive droplets check, as well as a dataframe of Sample-Target pairs to EXCLUDE from this check.
Sample-Target pairs example:
If the dataframe looks like:
| Sample | Target |
|---|---|
| POS | N1 |
| BCOV | BCOV |
| EXT | N1 |
Then the code will look for any instances where the Sample column contains the string “POS” AND the Target column contains the string “N1”, and any instances where the Sample column contains the string “BCOV” AND the Target column contains “BCOV”, etc. Those rows are REMOVED from consideration, and only Sample/Target combinations that remain within the dataframe of laboratory data will be considered further. The goal is for the system to only consider sample rows, NOT controls.
For each unique Sample/Target pair left for consideration, the sum of the Positives columns is calculated. For example, if you had run a sample in triplicate and the Positives value for the three wells were 1, 6, and 12, then the sum would be 19. If any of those sums calculated are less than the numeric indicator for the sum of positive droplets check, then the Sample-Target pairs that are low would be printed to the console.
The output of this function is a dataframe with a new column added, called sample_wells_positives7. This column set to 0 if the sum of Positives is greater than or equal to the set limit, set to 1 if the sum of Positives is less than the set limit, and NA if the row was excluded from consideration.
Function:
w0700_pos_droplet_sum(new_file_in, sum_pos_drop = 4, controls_to_drop)
w0750_neg_droplet_samples()
Basic Description: Sample Negative Droplet Sum Check, Checking non-control wells for instances of low negative droplet counts; Optional stop.
This function is meant to be used to check non-control wells for low negative droplet counts. It can be used as just a check function, or as a check that will stop code from running.
This function takes in a dataframe of laboratory data, a numeric indicator for the sum of negative droplets check, as well as a dataframe of Sample-Target pairs to EXCLUDE from this check. Finally, it takes in a character string, either “yes” or “no”, to indicate whether the user does (yes) or does not (no) want to treat the check as a stop check.
Sample-Target pairs example:
If the dataframe looks like:
| Sample | Target |
|---|---|
| POS | N1 |
| BCOV | BCOV |
| EXT | N1 |
Then the code will look for any instances where the ‘Sample’ column contains the string “POS” AND the ‘Target’ column contains the string “N1”, and any instances where the ‘Sample’ column contains the string “BCOV” AND the ‘Target’ column contains “BCOV”, etc. Those rows are REMOVED from consideration, and only Sample/Target combinations that remain within the dataframe of laboratory data will be considered further. The intended purpose is for the system to only consider sample rows, NOT controls.
For each unique Sample/Target pair left for consideration, the sum of the ‘Negatives’ columns is calculated. For example, if you had run a sample in triplicate and the ‘Negatives’ value for the three wells were 1, 6, and 12, then the sum would be 19. If any of those sums calculated are less than the numeric indicator for the sum of negative droplets check, then the Sample-Target pairs that are low would be printed to the console.
STOP ALERT: If “yes” is entered as stop_choice, and any of the samples have fewer than the numeric indicator for the sum of negative droplets check, the code will STOP RUNNING.
If “no” is entered instead, the output of this function will be a dataframe with a new column added, called ‘sample_wells_negatives75’. This column set to 0 if the sum of ‘Negatives’ is greater than or equal to the set limit, set to 1 if the sum of ‘Negatives’ is less than the set limit, and ‘NA’ if the row was excluded from consideration.
This function returns a list with the first element being a dataframe just like the input data frame, with one new column (sample_wells_negatives75) added, and the second element being either 0 (for no failure stop) or 1 (for failure stop)
Function:
w0750_neg_droplet_samples(new_file_in, sum_neg_drop = 4, controls_to_drop, stop_choice = "yes")
w0800_recover_control_check()
Basic Description: Recovery Control Check; Checking if average number of positive droplets is low(er than expected)
This function is used as a recovery control check, indicating if there are any wells where any wells that contain a tested sample with a Target of the recovery control (such as BCOV) are particularly low.
The function takes in a laboratory dataframe, a character string indicating your recovery control abbreviation (ex. “BCOV”), a vector of character strings that indicate the control samples to exclude, and a limit percent in decimal form. The default limit percent is 0.3 (30%). If there are no recovery wells to consider based on the information provided, “There were no Recovery Control / Sample Wells to consider.” will be written out to the console.
For the vector of character strings to indicate control sample exclusion, an example might be: c(“POS”, “NEG”, “EXT”, “NV”)
This is used to exclude the control Sample from rows where “BCOV” is the Target. The goal is to leave only Sample == extraction control (“BCOV”) & Target == extraction control (“BCOV”) rows, as well as all sample testing rows with extraction control (“BCOV”) as the Target.
The threshold is calculated as the average number of positive droplets (Positives) in the Recovery Control Sample-Target pairs (i.e. both the Sample and the Target are the recovery control; i.e. BCOV-BCOV) multiplied by the set limit percent.
For the wells that contain a tested sample with a Target of the recovery control (such as BCOV), the average number of positive droplets (Positives) is calculated for all Sample-Target pairs (run in duplicate, triplicate, etc.). If any of those averages is less than the threshold, the rows are marked. The sample names are printed to the console in this case.
This function returns a dataframe with a new column called recovery_flag8 that has a value of 1 if the relevant row was below the set limit and otherwise has a value of 0. If the row wasn’t involved in the check, it will have a value of NA.
Function:
w0800_recover_control_check(new_file_in, recovery_control, control_ids, limit_percent = 0.3)
w0900_positives_comparison_rule()
Basic Description: Target Positives Droplet High Limit
This function is optional. It takes as input:
a laboratory data frame
a vector of character strings indicating the ‘Sample’ values of interest that indicate the positive control samples (ex. “POS”)
a vector of character strings indicating the ‘Target’ values of interest (ex. “N1”)
a vector of character strings that indicate the control samples to exclude
a numeric threshold limit (default value = 3)
For the two Sample and Target character string vectors, the two should occur in order. For example, if you’re looking to check N1 samples and RV samples on the same data plate:
| Sample | Target |
|---|---|
| POS | N1 |
| RV | RV |
Then the two vectors should be:
Sample vector: c(“POS”, “RV”) Target vector: c(“N1”, “RV”)
The threshold for marking sample rows is calculated as the average number of positive droplets in all wells where the positive control indicator string is in the Sample column and the indicated target string is in the Target column, multiplied by the numeric threshold limit. Well rows that are NOT controls, where the Target contains the indicated target string(s), that have a Positives column value that is greater than this value are marked.
This is just a warning/notification function. The Sample, Target, and Positives value for each row that violates the threshold will be printed to the console. A dataframe is returned from this function, and it will contain a new variable called sample_pos_limit_flag9 that will have a value of 1 if the row violated the threshold and a value of 0 if it did not violate the threshold OR if it was not considered as part of the check.
Function:
w0900_positives_comparison_rule(new_file_in, pos_samp_str, target_str, control_ids, thresh_size = 3)
w1000_remove_rows_as_chosen()
Basic Description: Removing QAQC Rule Breakers
This function takes in a data frame of laboratory data that has been through most if not all of the prior QAQC checks. It also takes as input, a vector of numbers that correspond to the rules that, if there were only “mild” rule breaks (aka that did not previously trigger a STOP), you’d like to remove those rule breaking rows. The default value for this vector is c(2, 3, 5, 6).
This function can currently accommodate this process for rules:
2.0 Accepted Droplet Count Check (2):
accepted_droplet_limit2,accepted_droplet_count23.0 NTC Control Check (3):
ntc_control_check35.0 Control Warning - Positives Droplets (5):
control_pos_drop_soft56.0 Extraction & Negative Control Check (6):
ext_neg_control_check67.0 Sample Positive Droplet Sum Check (7):
sample_wells_positives77.5 Sample Negative Droplet Sum Check (7.5):
sample_wells_negatives758.0 Recovery Control Check (8):
recovery_flag89.0 Target Positives Droplet High Limit (9):
sample_pos_limit_flag9
For all of these rules, this function removes any rows with a value of 1 in the relevant mark column. In addition, for 2.0 Accepted Droplet Count Check,if any sample set had more than one well that broke the rule within the set, the entire sample set is removed.
Function:
w1000_remove_rows_as_chosen(data_file_in, rules_out_v = c(2, 3, 5, 6))
For wVal Calculations
This section and functions are in-progress. The use of these functions is not currently recommended. (as of 2025-11-13)
These functions (r0100 - r0600) assume a main user dataframe that contains the following variables:
- Required:
gcper100ml- Should be set to the measurement of a particular pathogen taken from a single wastewater sampleid- identifier marking the site that is providing the sampledate- Date the sample was collected on in YYYY-MM-DD formatpopulation_served- estimated population served of the site (id); can beNAsampletype- type of sample collected; can beNAsitetype- type of collection site; can beNAmicrobial_val- Value of the microbial normalization measurement for the given site and sample combination; can beNAflow_val- Value of the flow normalization measurement for the given site and sample combination; can beNA
The dataframe is assumed to have a single row per testing site per sample. The dataframe is assumed to only consist of sample measurements for a single pathogen.
The methods and calculations included here for wVal are taken from the Wastewater Viral Activity Level methods developed by the Centers for Disease Control and Prevention (CDC). For information regarding this, please visit https://www.cdc.gov/nwss/data-methods.html. The components for calculating these levels in the original published method, as well as the changes published August 2025, are available in these functions.
1. r0100_inclusion_exclusion()
Basic Description: Determine factors on which to include multiple wastewater sites into wVal calculation
This function takes in a dataframe of wastewater data measurements and site metadata and a series of numeric and character vector values.
If one does not want to consider a particular metadata point, the value can be set at NA. This is the default for all values.
To use the pop_serve_num input, the dataframe must include a variable called population served. If pop_serve_num is provided a numeric value, the data frame is filtered to only include sites with a metadata population served value of greater than or equal to the provided numeric value.
To use the sample_type_list input, the dataframe must include a variable called sampletype. If sample_type_list is provided a vector of character strings, the data frame is filtered to only include sites with a metadata sampletype included in the provided character vector.
To use the testing_site_type_list input, the dataframe must include a variable called sitetype. If testing_site_type_list is provided a vector of character strings, the data frame is filtered to only include sites with a metadata sitetype included in the provided character vector.
For all cases, if the input is left blank, all of the sites will be included regardless of their value for the related dataframe variable.
Any/all of the three inputs can be used or not.
Function:
r0100_inclusion_exclusion(data_file, pop_serve_num = NA, sample_type_list = NA, testing_site_type_list = NA)
2. r0200_normalize()
Basic Description: Normalization Choice and Implementation
This function takes in a dataframe of wastewater site data, as well as a (normal_yesno) character string indicating “yes” or “no” if the user would like to apply a normalization method, and a (choose_norm) character string indicating the method that would be used, if ‘yes’. For this function to work, the dataframe must, at a minimum, contain a column called gcper100ml. Depending on the use of the normalization methods, microbial_val and/or flow_val must also be present.
gcper100ml= measurement of a given pathogen in the wastewater samplemicrobial_val= measurement (in the same units asgcper100mlvalues) of the microbial normalization choice in the wastewater sampleflow_val= measurement of the water flow to normalize thegcper100mlvalue by
If the user inputs ‘no’ for normal_yesno, then a new column called normalized_measurement is added, and it is set as the value of gcper100ml. Any rows where normalized_measurement is NA are removed, and the dataframe is returned.
If the user inputs ‘yes’ for normal_yesno, then the user must also provide a function input for choose_norm. This can be either:
“microbial”: A new column called
normalized_measurementis set as the value ofgcper100ml/microbial_val“flow”: A new column called
normalized_measurementis set as the value ofgcper100ml/flow_val“mix_flow_first”: Both
gcper100ml/microbial_valandgcper100ml/flow_valare calculated.normalized_measurementis filled with the value ofgcper100ml/flow_valfirst. Any missing values are filled withgcper100ml/microbial_val“mix_microbial_first”: Both
gcper100ml/microbial_valandgcper100ml/flow_valare calculated.normalized_measurementis filled with the value ofgcper100ml/microbial_valfirst. Any missing values are filled withgcper100ml/flow_val
Any rows where normalized_measurement is NA are removed, and the dataframe is returned.
If the user inputs something that is not “microbial”, “flow”, “mix_flow_first”, or “mix_microbial_first”, then the system will STOP after printing “Unaccepted function input; normalization method must be either ‘microbial’, ‘flow’, ‘mix_flow_first’, or ‘mix_microbial_first’, not:”and the user input to the console.
If the user inputs something that is not ‘yes’ or ‘no’ for normal_yesno, then the system will STOP after printing “Unaccepted function input; normalization choice must be either ‘yes’ or ‘no’, not:” and the user input to the console.
Function:
r0200_normalize(wastewater_data_in, normal_yesno, choose_norm)
3. r0300_logtransform()
Basic Description: Log Transformation of Values
This function takes in a dataframe of wastewater measurement data, as well as a character value of “yes” or “no” depending on whether the user would like to remove outliers in a z-score method. This function also takes in a threshold z score value (numeric) that has a default value set as 4.
The log() of the normalized_measurement is calculated in a new column called log_value. As log(0) = -Inf, those rows are removed and the number of rows that were removed because of this is messaged to the console.
If “no” for outlier_removal, then the remaining dataframe is returned from this function.
If “yes” for outlier_removal, then the dataframe is grouped by id (by site) and the average and standard deviation of log_value is calculated. z_score is calculated as zero if the overall standard deviation is NA or if the overall standard deviation is zero. Otherwise, z_score is calculated as the absolute value of the sample log_value minus the overall mean log value, divided by the overall standard deviation. Any rows where the calculated z_score is less than or equal to the provided z_score_threshold are kept (so, any rows where the calculated z_score is greater than the provided z_score_threshold are removed).
The number of rows that are removed due to z-score thresholding are messaged to the console. Any extranneous variables created during the z-score calculations are removed and the remaining dataframe is returned from this function.
Function:
r0300_logtransform(wastewater_data_in, outlier_removal, z_score_threshold = 4)
4. r0400_baselineassignment()
Basic Description: Determining Baseline Values
This function takes in a dataframe of wastewater sample data by site and a character string of “cdc_v1”, “cdc_v2”, “cdc_v3”, “cdc_v4”, or “all_data” to determine the method of determining the “baseline” values for every site over time for the dataframe.
If method_choice is set as “cdc_v1” then the baseline is set according to the original CDC baseline rules for SARS-CoV-2:
For each combination of site, data submitter, PCR target, lab methods, and normalization method, a baseline is established. The “baseline” is the 10th percentile of the log-transformed and normalized concentration data within a specific time frame.
SARS-CoV-2: For site and method combinations (as listed above) with over six months of data, baselines are re-calculated every six calendar months (January 1st and July 1st) using the past 12 months of data. For sites and method combinations with less than six months of data, baselines are computed weekly until reaching six months, after which they remain unchanged until the next January 1st or July 1st, at which time baselines are re-calculated.
If method_choice is set as “cdc_v2” then the baseline is set according to the original baseline rules, using the 18 month look-back period used for Influenza A and RSV.
For sites and method combinations with less than twelve months of data, baselines are computed weekly until reaching twelve months, after which they remain unchanged until the next August 1st, at which time baselines are re-calculated.
For site and method combinations (as listed above) with over twelve months of data, baselines are re-calculated every August 1st using all available data in the previous 18 months.
For “cdc_v1” and “cdc_v2”, week_required must be considered. In the original CDC wval calculations, this value was set to 6 for COVID data, and 10 for influenza A and RSV.
August 2025 updates - RSV & Flu
For “cdc_v3”, baseline calculations are made based on the CDC August 2025 updates, including, aligning site-level baselines for COVID-19, influenza A, and RSV to 24 months. week_required for this method would be set to 8 weeks.
August 2025 updates - COVID
For “cdc_v4”, baseline calculations are made based on the CDC August 2025 updates, including, aligning site-level baselines for COVID-19, influenza A, and RSV to 24 months, and shifting timing of the biannual COVID-19 WVAL updates to April and October. week_required for this method would be set to 8 weeks.
If method_choice is set as “all_data” then the baseline is set as the 10th percentile of all log_values for each site. The standard deviation of all log_values is calculated, and the baseline minimum date and maximum date are set as the min and max available date for all data per site. Any rows where the baseline is NA are removed, and any rows where the standard deviation is zero are removed. The final dataframe is returned.
Per CDC methodology, as of the August 15, 2025 methodology change, “all historical wVal values are updated with the new baseline when recalculated”. If you’d like to use that method with the “cdc_v4” option, hist_override can be set equal to 1. By default, this behavior is not chosen, and hist_override is set equal to 0.
For all methods, the returned dataframe consists of: id, date, sampletype, sitetype, population_served, gcper100ml, microbial_val, flow_val, normalized_measurement, log_value, oldest_date, days_since_first, x_months_data_yn, sample_counter, multiple_durations, baseline, stdev, baseline_mindate, baseline_maxdate, baseline_datapoints
Function:
r0400_baselineassignment(wastewater_data_in, method_choice, week_required = 6, hist_override = 0)
5. r0500_wval_sitecalc()
Basic Description: Calculating wVal for individual site(s)
Function that takes in wastewater dataframe with columns of: - log_value - baseline - stdev - date - id
(generated as output from r0100 to r0400)
Calculates the individual wVal level for all sites included in the input dataframe, using the formula:
\[e^{log_value - baseline \over stdev}\]
A dataframe is created: - id: Site identifier or name - year: year of the sample period - week: week of the sample period - avg_min: minimum sample date within the week sample period - avg_max: maximum sample date within the week sample period - average_wval_calc: average wval of all samples in the sample period week for the given id - count_samples: number of samples included in the calculation for the sample period week
Using the average_wval_calc, a “level” is assigned to each site’s week of data
| Function Input | Minimal | Low | Moderate | High | Very High |
|---|---|---|---|---|---|
| SC2_v1 | Up to 1.5 | > 1.5 and <= 3 | > 3 and <= 4.5 | > 4.5 and <= 8 | > 8 |
| FLU_v1 | Up to 1.6 | > 1.6 and <= 4.5 | > 4.5 and <= 12.2 | > 12.2 and <= 20.1 | > 20.1 |
| RSV_v1 | Up to 4 | > 4 and <= 8 | > 8 and <= 12 | > 12 and <= 20 | > 20 |
| SC2_v2 | Up to 2 | > 2 and <= 3.4 | > 3.4 and <= 5.3 | > 5.3 and <= 7.8 | > 7.8 |
| FLU_v2 | Up to 2.7 | > 2.7 and <= 6.2 | > 6.2 and <= 11.2 | > 11.2 and <= 17.6 | > 17.6 |
| RSV_v2 | Up to 2.5 | > 2.5 and <= 5.2 | > 5.2 and <= 8 | > 8 and <= 11 | > 11 |
Finally, any instances where the average_wval_calc is not a finite value are replaced with NA.
Function:
r0500_wval_sitecalc(wastewater_data_in, org)
6. r0600_wval_regioncalc()
Basic Description: Calculating wVal for a User Defined Region
Function that takes in wastewater dataframe with columns of: “id”, “year”, “week”, “average_wval_calc”, also must have “Geography” if site_to_regional_crosswalk is not used. (generated as output from r0100 to r0500)
Function also takes in site_to_region_crosswalk, method, and org.
If site_to_regional_crosswalk is provided, it must be a dataframe with columns of:
id: Site identifier or name
Geography: Region(s) the user is attempting to roll-up multiple sites to.
weight: Weight to apply to the
idwithin the region wval calculation. Only relevant if using “mean” asmethod. If the user wants standard mean calculation applied, allweightshould be 1.
If site_to_regional_crosswalk is provided, it is merged onto the wastewater dataframe by the id variable. Only instances where the id is in both dataframes will continue through the remainder of the calculations.
The resulting dataframe is grouped by Geography, week, and year into:
Geography: Region identifier or name
year: year of the sample period
week: week of the sample period
avg_min: minimum sample date within the week sample period
avg_max: maximum sample date within the week sample period
region_wval_calc: if
methodis ‘median’, then it’s the median value ofaverage_wval_calcwith anyNAs left out of consideration. ifmethodis ‘mean’ then it’s the weighted average value ofaverage_wval_calcwith anyNAs left out of considerationcontributing_site_count: number of sites (
ids) included in the calculation for the sample period week
Using the region_wval_calc, a wval_level is assigned to each Geography’s week of data
| Function Input | Minimal | Low | Moderate | High | Very High |
|---|---|---|---|---|---|
| SC2_v1 | Up to 1.5 | > 1.5 and <= 3 | > 3 and <= 4.5 | > 4.5 and <= 8 | > 8 |
| FLU_v1 | Up to 1.6 | > 1.6 and <= 4.5 | > 4.5 and <= 12.2 | > 12.2 and <= 20.1 | > 20.1 |
| RSV_v1 | Up to 4 | > 4 and <= 8 | > 8 and <= 12 | > 12 and <= 20 | > 20 |
| SC2_v2 | Up to 2 | > 2 and <= 3.4 | > 3.4 and <= 5.3 | > 5.3 and <= 7.8 | > 7.8 |
| FLU_v2 | Up to 2.7 | > 2.7 and <= 6.2 | > 6.2 and <= 11.2 | > 11.2 and <= 17.6 | > 17.6 |
| RSV_v2 | Up to 2.5 | > 2.5 and <= 5.2 | > 5.2 and <= 8 | > 8 and <= 11 | > 11 |
Finally, any instances where the region_wval_calc is not a finite value are replaced with NA.
Function:
r0600_wval_regioncalc(wastewater_data_in, site_to_region_crosswalk = NA, method = "median", org)
For Alert Communications Around Positivity
Coming Soon!
![]()